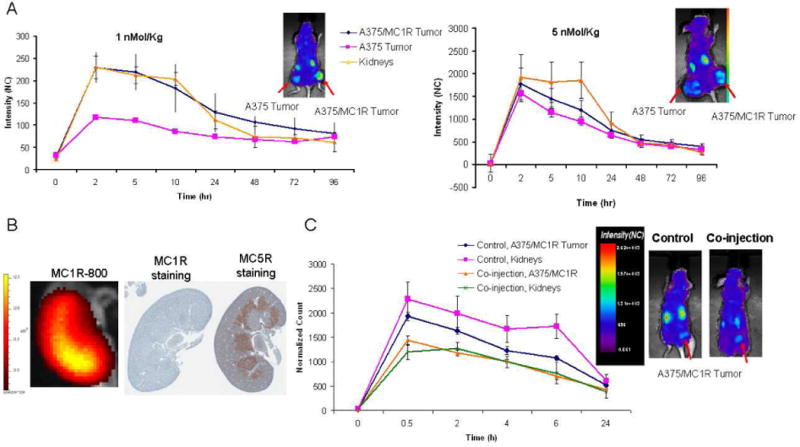
Figure 5.

In vivo pharmacokinetics study of MC1RL-800. A) Plots of normalized fluorescence values for high- and low-expressing tumors and kidneys over a longitudinal time-course following administration of low (1 nmol/kg) and high (5 nmol/kg) doses of probe. Insets show representative normalized fluorescence intensity map overlays on visible light images of mice bearing bilateral flank xenograft tumors, 2 hours post intravenous injection of the probe that were acquired using the Optix-MX-3 instrument. B) A representative ex vivo fluorescence image (left) of kidney 2 hr after probe injection acquired using the IVIS 200 instrument and corresponding IHC stained sections of MC1R (center) and MC5R (right). C) Co-injection of 1 nmol/kg of MC5R specific ligand and 5 nmol/kg of MC1RL-800 (right image) to reduce kidney uptake of the probe. Inset shows representative normalized fluorescence intensity map overlays, 30 min post intravenous injection of the probe (control, left image) and probe plus MC5R ligand co-injection (right image). Images were acquired using the Optix-MX-3 instrument. Data represent mean ± s.d. NC: Normalized Counts.
