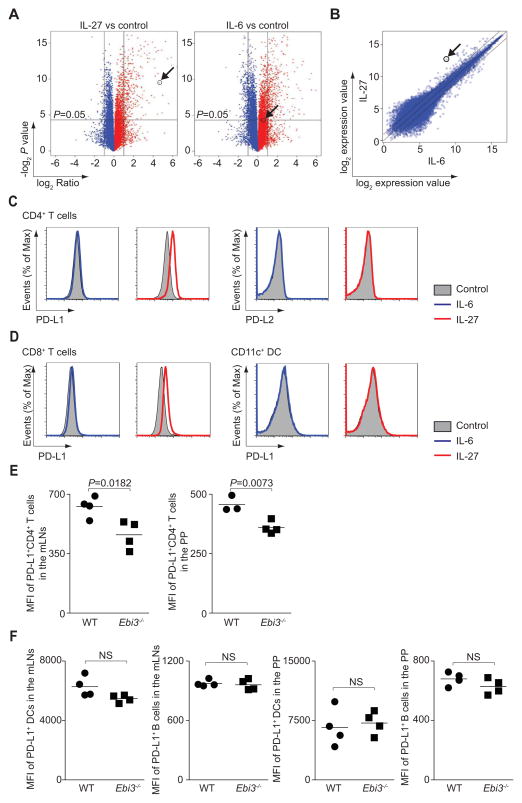
Figure 3. IL-27 priming rapidly induces PD-L1 on naïve CD4+ T cells.
(A–C) Naïve CD4+ T cells were cultured in medium alone (control), or stimulated with IL-6 or IL-27 for 3 hours before analyzing differential gene expression by microarray. The arrow indicates Cd274 expression. Volcano plots depict differential gene expression induced by IL-27 or IL-6 compared to control (A). Comparison of IL-27- and IL-6-dependent gene expression is shown as a scatter plot (B). (C and D) Naïve CD4+ T cells (C), naïve CD8+ T cells or freshly isolated CD11c+ DCs (D) were stimulated as in A and expression of PD-L1 and PD-L2 was determined by flow cytometry. (E and F) Wild type or Ebi3−/− mice were orally administered T. gondii, and sacrificed on day 9. Mesenteric lymph node (mLN) and Peyers patch (PP) cells were gated on CD4+, TCR-β +, CD8−, and Foxp3− cells. PD-L1 expression is shown as percentages of CD4+ T cells, and by geometric mean channel fluorescence (E). DCs were gated on CD3−, NK1.1−, CD19− and CD11chigh. B cells are gated on CD3−, NK1.1− and CD19+ (F). The experiment shown is representative of 2 separate experiments, (mean values, NS, not significant).

