
Figure 3.
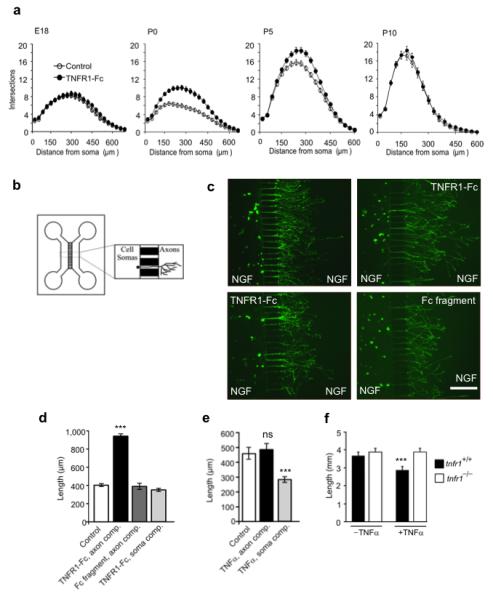
TNFR1-Fc acts locally on SCG axons to enhance growth over a window of postnatal development. (a) Sholl plots of the neurite arbors of E18, P0, P5 and P10 SCG neurons cultured for 24 h with or without 10 ng/ml TNFR1-Fc in presence of 10 ng/ml NGF. (b) Schematic illustration of the two-chamber microfluidic device. (c) Representative images of calcein-AM labeled P0 SCG neurons that were cultured for 24 h in a two-compartment microfluidic device containing 10 ng/ml NGF in both compartments, with either 10 ng/ml TNFR1-Fc or 10 ng/ml Fc fragment in the axon compartment or TNFR1-Fc in the soma compartment. Scale bar = 100 μm. (d,e) Bar charts of mean axon length of neurons projecting axons into the axon compartment under the experimental conditions indicated. The data represent the mean ± s.e.m of 9 independent experiments. (f) Plots of neurite arbor length of P0 SCG neurons from tnfr1+/+ and tnfr1−/− mice cultured for 24 h with NGF in the presence and absence of 10 ng/ml TNFα. The data shown represent the mean ± s.e.m of neurite arbor data 150 neurons per condition combined from 3 to 5 separate experiments of each type (*** indicates P<0.001, statistical comparison with control).