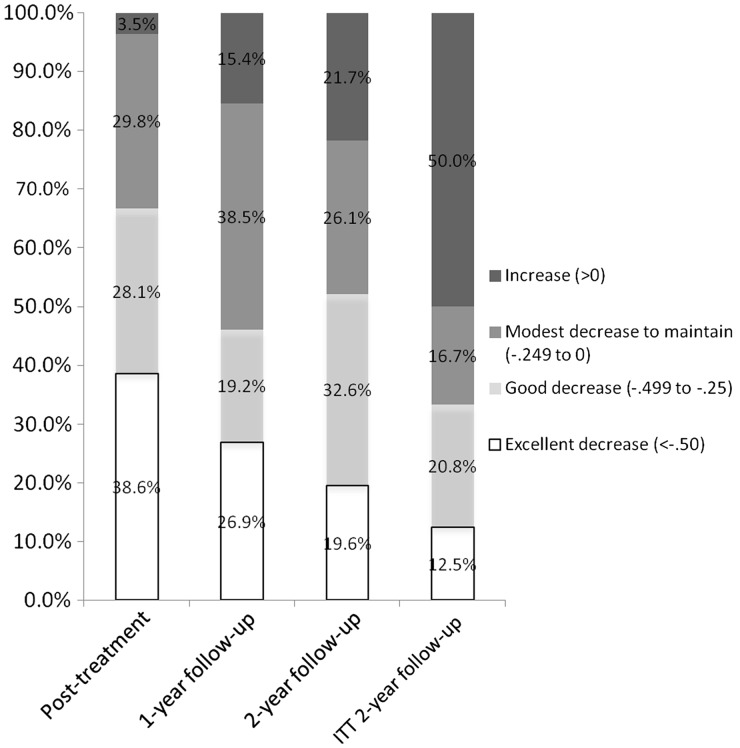
Figure 3.
Categories of child BMI z-score change for assessment completers at each time point (n = 57 for posttreatment; n = 52 for 1-year follow-up; n = 46 for 2-year follow-up) and for ITT (intent-to-treat) sample of children (n = 72) assuming an increase in BMI z-score at 2-year follow-up for those with missing 2-year follow-up data (n = 26).

