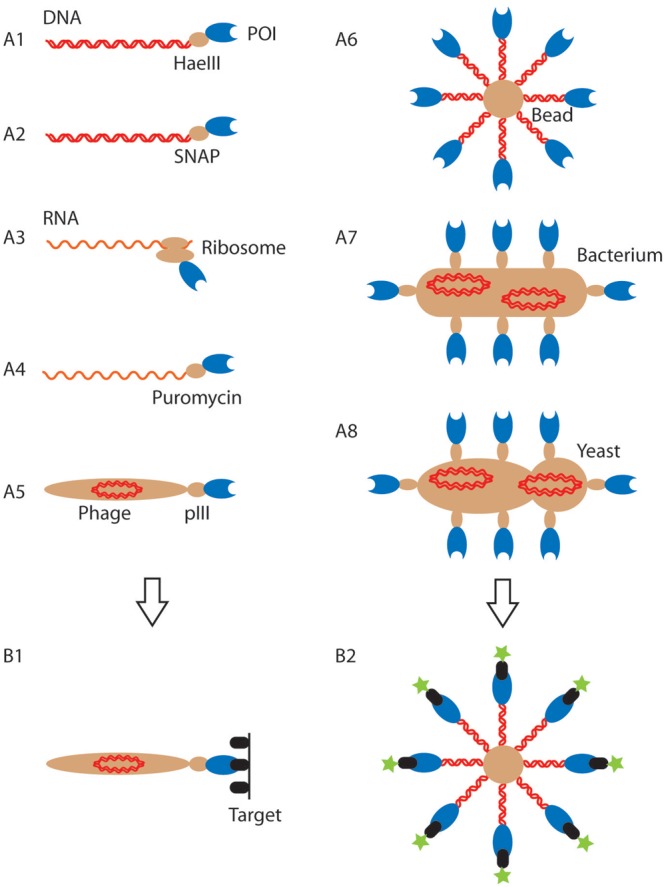
Fig. 1.

Overview of current display systems. (A) Cartoon representation of different genotype–phenotype linkages used in directed evolution (genotype: red; phenotype: blue; entity providing the genotype–phenotype link (protein, ribosome, phage, cell or bead): light brown; the images are not drawn to scale). The specific systems shown are DNA-display: M-HaeIII display (A1), SNAP display (A2); RNA display: ribosome display (A3), mRNA display (A4); phage display (A5). The systems shown in A1–A5 have one copy of the genotype and one or a few copies of the expressed protein. By contrast, cell-display methods (bacterial: A7; yeast: A8) have multiple copies of genotype and phenotype. This work describes BeSD (A6), which shares features of both formats, as the displayed protein is expressed in vitro, but displayed in up to 106 copies (rather than a single one in other in vitro systems), thus endowing BeSD with features that were hitherto exclusive to cell-display systems. (B) The display formats imply different selection approaches: panning (shown in B1 for phage display (A5), but carried out analogously for systems A1–4) is based on immobilization of the target on a surface and capture of protein binders by affinity selection. In this process quantitative analysis and direct control of ligand-binding parameters are impossible. Further labor-intensive biophysical measurements are often necessary to assess the strength and specificity of affinity-selected binders. By contrast, flow cytometry (FACS) measures the number of fluorescent target molecules bound directly (B2) and thus screens every mutant in the library, allowing a quantitative threshold to be set as the basis for a considered choice during selection. POI, protein or peptide of interest.
