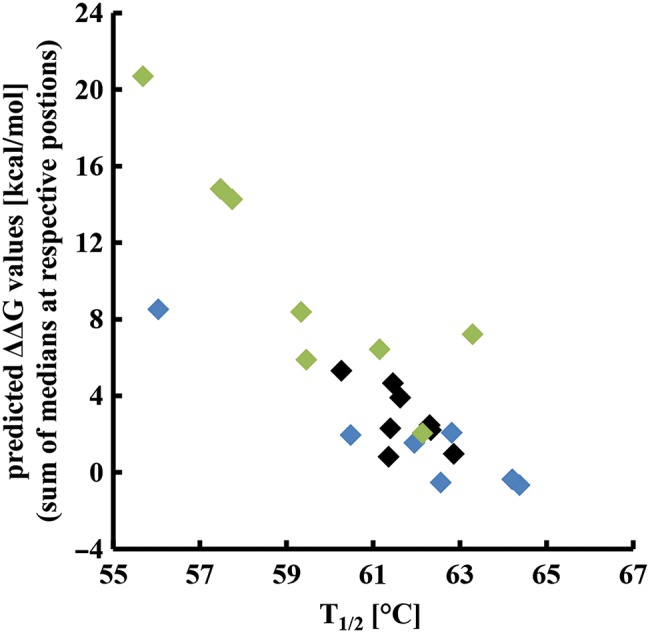
Fig. 4.

Correlation between computationally predicted ΔΔG values and experimentally determined T1/2 values. Using the FoldX function <BuildModel>, ΔΔG values determined for all possible mutations at the respective loop positions were calculated and median values for each position were determined. To estimate the additive effect of randomization of more than one residue, ΔΔG medians were summed up according to the different library designs and plotted against the experimentally obtained T1/2 values (Table II).
