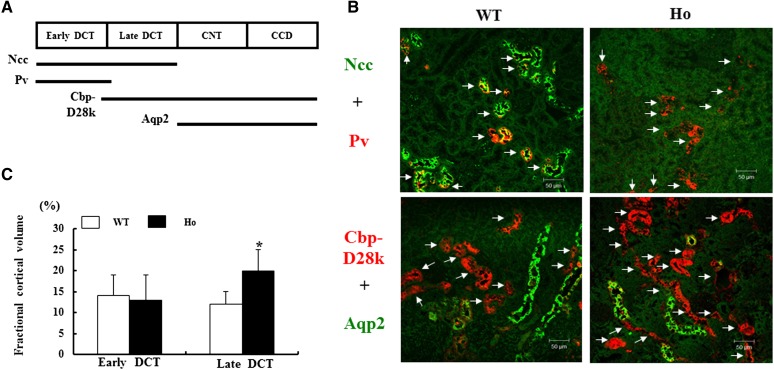
Figure 3.
Hypertrophic late DCTs cellular volume in Ncc T58M knock-in mice. (A) Distribution of Ncc, parvalbumin (Pv), Calbindin (Cbp)-D28k, and Aqp2 in the distal renal tubules. (B) Representative early and late DCT segments by double immunofluorescence of Ncc (green) and Pv (red) or Cbp-D28k (red) and Aqp2 (green) (arrows indicate early DCT [upper panels] and late DCT [lower panels] segments) and (C) their semi-quantification of fractional cortical volume in the cortex of WT and Ho mice (n=5/group). *P<0.05 in WT versus Ho comparison. CNT, cortical connecting tubule; CCD, cortical collecting duct. Scale bar, 50 μm.

