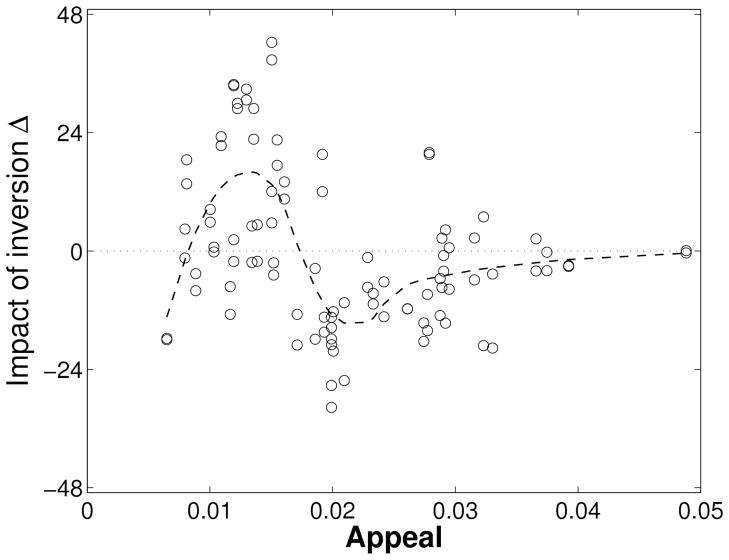
Figure 9.
Relationship between estimated impact of inversion, Δ, and song appeal (both estimates presented on the same axis). The dashed line is a loess fit to the data (α = 0.6, λ = 2) and is intended as a visual aid (Cleveland 1993) In general, the “worst” songs were helped by the inversion, the “good” songs were hurt by it, and the success of the “best” songs was largely unaffected.

