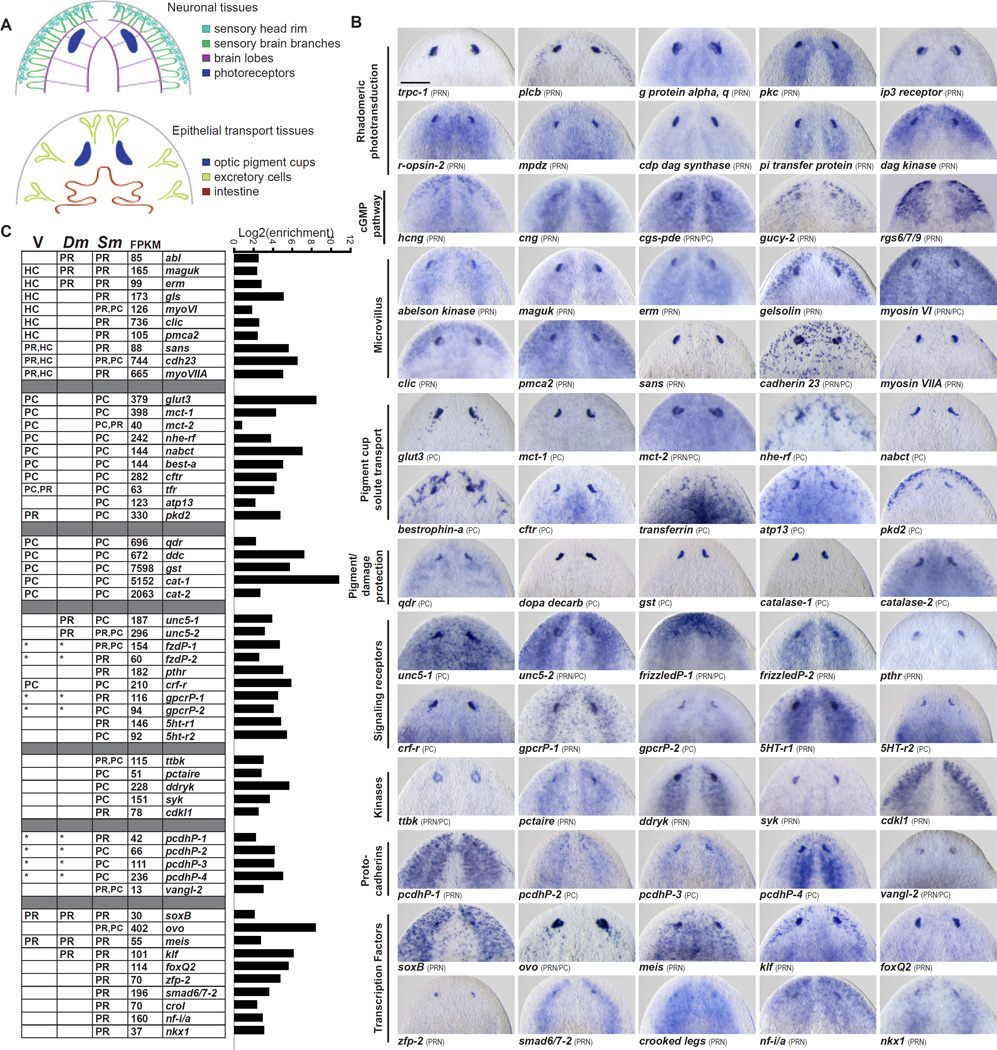
Figure 2. An in situ hybridization screen of genes with enriched expression in planarian eyes.
(A) Schematic of tissue types in the head that appear in expression patterns. PRN expression domains curve toward the midline, and PC expression domains curve away from the midline
(B) in situ hybridization of eye-enriched transcripts, grouped by predicted function. Full names and additional orthology information are given in Table S1.
(C) Plot of the log2 of fold enrichment (FPKM eye sample/FPKM control sample) for genes screened (see also Table S2). Values for rhabdomeric phototransduction and cGMP pathway genes are shown in Figure 1. Table shows FPKM values for genes in the eye sample and summarizes expression data from vertebrate (V), Drosophila (Dm), and planarian (Sm). PR, photoreceptor neuron; PC, optic pigment cell; HC, inner ear hair cell; asterisk indicates that planarian gene orthology could only be assigned to a broad gene family for which functions have been identified in the eyes of indicated species.
Scale bar, 200 µm.

