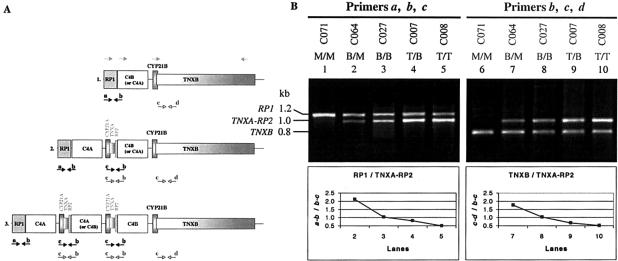
Figure 3.
Module-specific PCR analysis, to detect the modular variation of RCCX. A, Schematic diagram illustrating the approximate locations to which the primer sets a–c and b–d bind in the three modular haplotypes. B, Module-specific PCR for the RP1/TNXA-RP2 reaction, using primer set a–c (lanes 1–5, top), and for the TNXB/TNXA-RP2 reaction, using primer set b–d (lanes 6–10, top). The relative band intensities obtained from RP1 versus TNXA-RP2 or TNXB versus TNXA-RP2 were plotted in the graph and, except for lanes 1 and 6, are shown at bottom.

