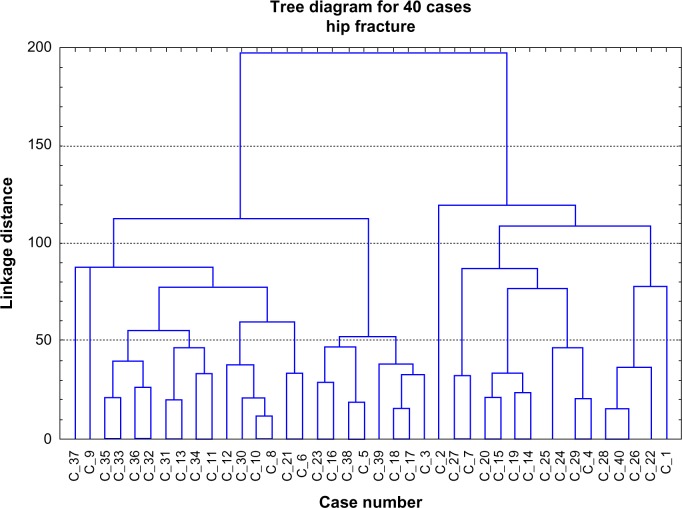
Figure 2.
Dendrograms for hierarchical agglomerate clustering of patients.
Notes: The X-axis represents the cases; each row on the Y-axis represents one patient. Because of the limited resolution of the dendrogram, cases were not labeled. The Y-axis represents the distance of linkage between the patient clusters. Highly correlated clusters are closer to the bottom side of the dendrogram, while less correlated clusters are more distant from the X-axis. As they move up the dendrogram, clusters get bigger; each horizontal line represents a merge. The Y-coordinate of the horizontal line is the similarity of the clusters that were merged.

