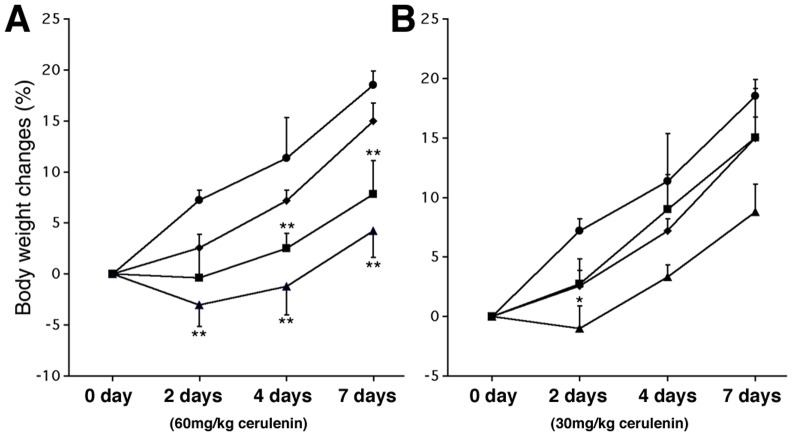
Figure 1. Body weight changes with cerulenin treatment.
The control (circle) and the vehicle alone (diamond) are shown in both panels. Panel A shows the body weight changes of the groups with 60 mg/kg cerulenin, given either daily (triangle) or every other day (square), panel B shows the groups with 30 mg/kg cerulenin, given either daily (triangle) or every other day (square). Statistical analysis in each experimental group was compared with the vehicle treated group. *: P<0.05; **: P<0.01.

