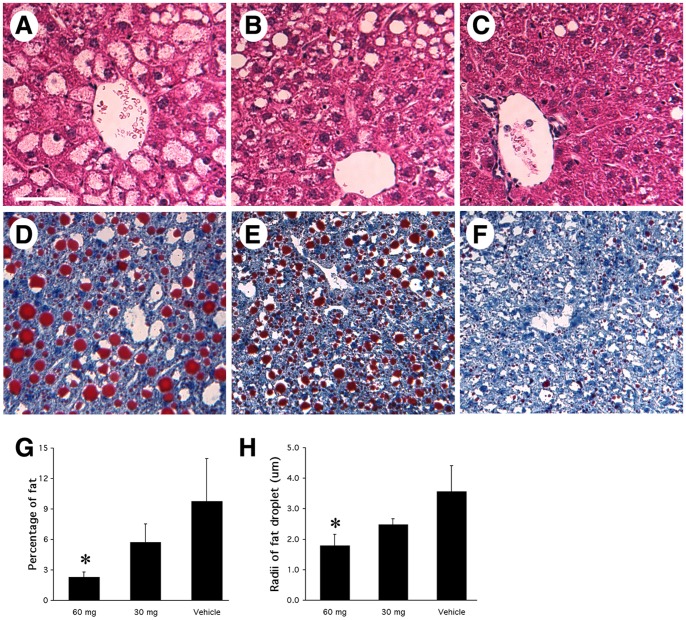
Figure 3. Histochemical analysis of ob/ob mouse livers with cerulenin treatment.
Panels A–C: H&E staining. A. vehicle-treated ob/ob mouse liver, shows most hepatocytes had a big fat droplet (pale staining, representing the empty space left behind when the fat is removed during tissue processing), which occupied most space in the hepatocytes, while the nuclei was localized to the periphery. B. cerulenin-treated (60 mg/kg/day for 2 days) ob/ob mouse liver, shows significantly decreased number and size of fat droplets. In most hepatocytes, microsteatosis dominated. C. cerulenin-treated (60 mg/kg/day for 7 days) ob/ob mouse liver. Except for a few fat droplets, the overall appearance of the liver was almost to normal, especially in the areas close to the central vein. Panels D–F: Oil-Red-O staining of ob/ob mouse liver with 7 days of treatment; Red signals represent fat droplets. The treatment was: D. vehicle only; E. cerulenin-treated (60 mg/kg/day) for 2 days; F. cerulenin-treated (60 mg/kg/day) for 7 days. G: percentage of fat content in liver cross sections with 7-day treatment of either 60 or 30 mg/kg/day cerulenin. H: size of fat droplets in liver cross sections with 7-day treatment of either 60 or 30 mg/kg/day cerulenin. Scale bar: 60 µm. *: P<0.05.

