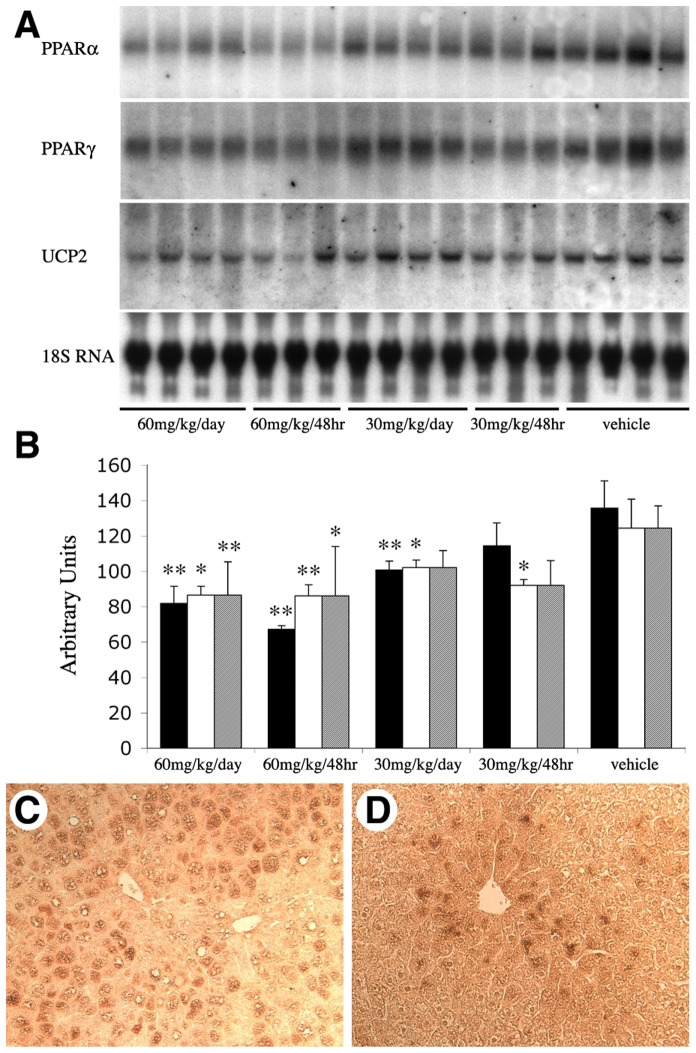
Figure 5. Expression of UCP2 and PPARα and γ.
A. Northern blot analysis of PPARα, PPARγ, and UCP2. ob/ob mouse livers received 7-day (every day or every other day) treatment of cerulenin or vehicle as indicated. 18 S RNA was used for normalization. B. The densitometric values are expressed as averages standardized to baseline. C (vehicle-treated) and D (60 mg/kg/day for 7 days) are PPARγ immunostaining signals in ob/ob mouse livers, Scale bar: 60 µm.

