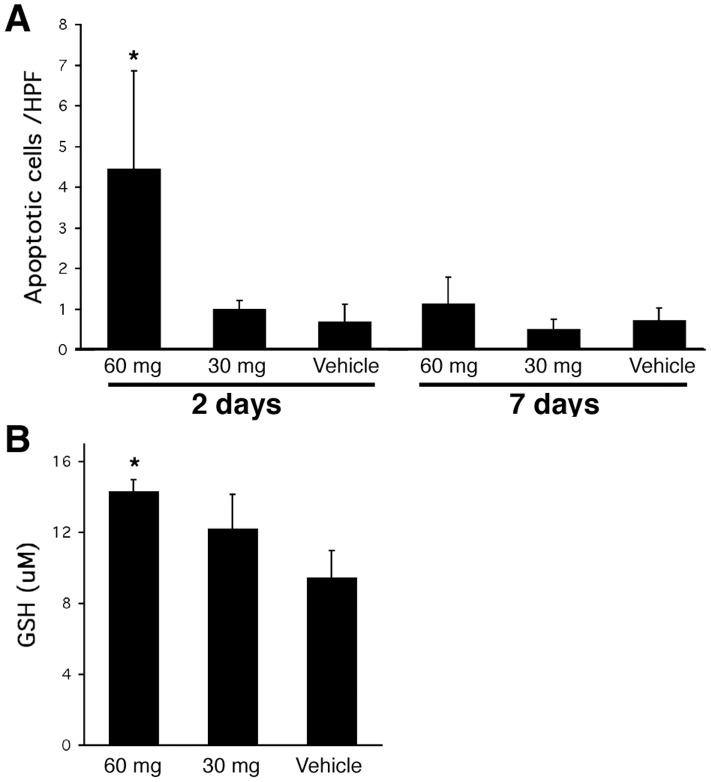
Figure 6. Apoptosis activity and GSH content.
A. Apoptotic activity in ob/ob mouse livers with cerulenin treatment as detected by TUNEL assay. Apoptotic cells with daily cerulenin treatment as indicated in the figure were counted directly under microscope and were expressed as the number of apoptotic cells per high power field (HPF, 100 x) under light microscope. B. GSH content in ob/ob mouse livers with 7-day daily cerulenin treatment. *: P<0.05.

