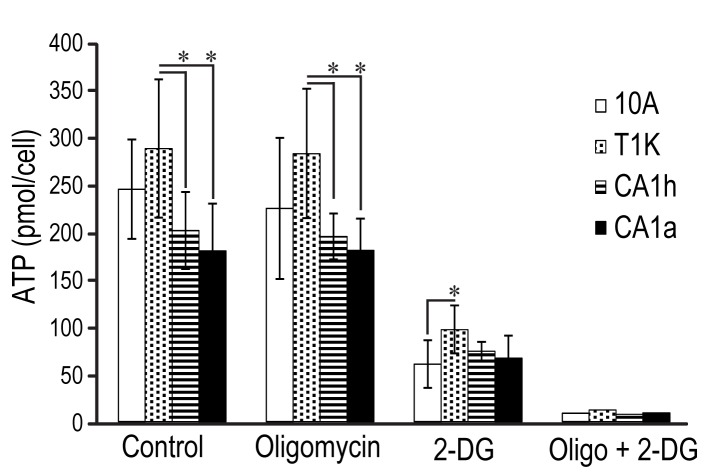
Figure 4. ATP generation relative to cell type and in response to the metabolic inhibitors, oligomycin alone, 2-DG alone, and the combination.
Absolute ATP levels were quantified in each cell line. Each bar represents the mean of four independent measurements, and error bars are standard deviation of the mean. Significant differences were determined by comparing values for each cell line to 10A by Wilson’s T-Test (*p<0.05).

