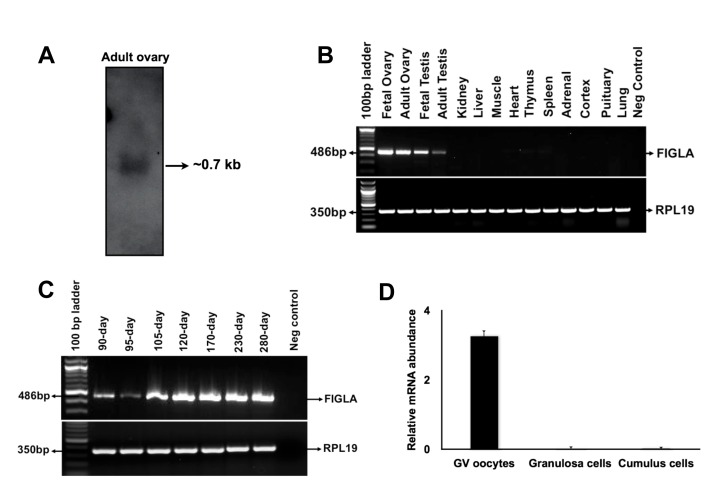
Figure 1. Analysis of bovine FIGLA mRNA expression.
(A) Northern blot analysis of FIGLA transcript. (B) Expression of FIGLA mRNA in various bovine tissues. (C) Expression of FIGLA mRNA in bovine fetal ovaries of different developmental stages. (D) Quantitative expression of FIGLA mRNAs in granulosa cells, cumulus cells and GV oocytes. Data were normalized relative to abundance of endogenous control ribosomal protein S18 (RPS18) and are shown as mean + SEM (n=3).

