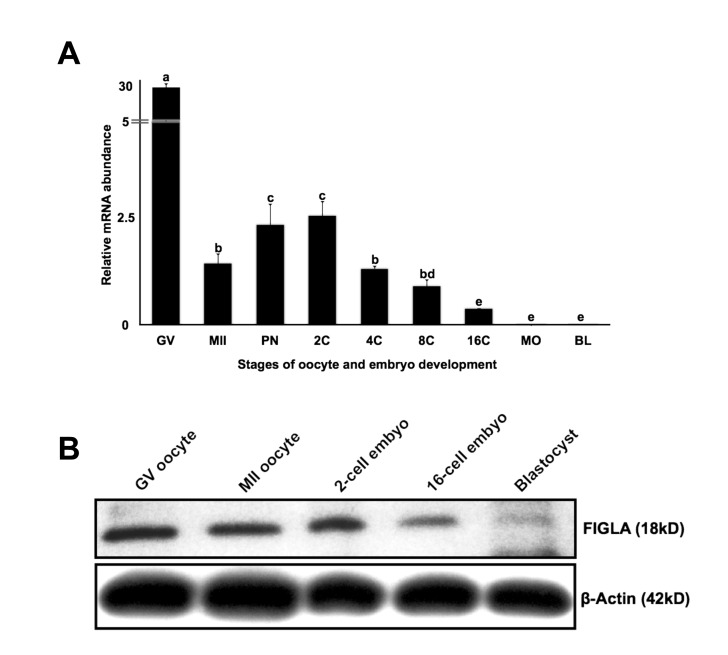
Figure 2. Expression of FIGLA mRNA and protein during oocyte maturation and early embryonic development.
(A) Analysis of steady-state levels of FIGLA mRNA in in vitro produced bovine pre-implantation stage embryos. The oocyte and embryo samples used in this experiment included GV and MII stage oocytes, pronuclear (PN), 2-cell (2C), 4-cell (4C), 8-cell (8C), 16-cell (16C), morula (MO) and blastocyst (BL) stage embryos. Data were normalized relative to abundance of exogenous control (GFP) RNA and are shown as mean + SEM (n = 4 pools of 10 embryos per stage). Different letters indicate statistical difference (P < 0.05). (B) Western blot analysis of FIGLA protein expression in bovine oocytes and early embryos using antibodies specifically against bovine FIGLA (25 oocytes or embryos per lane).

