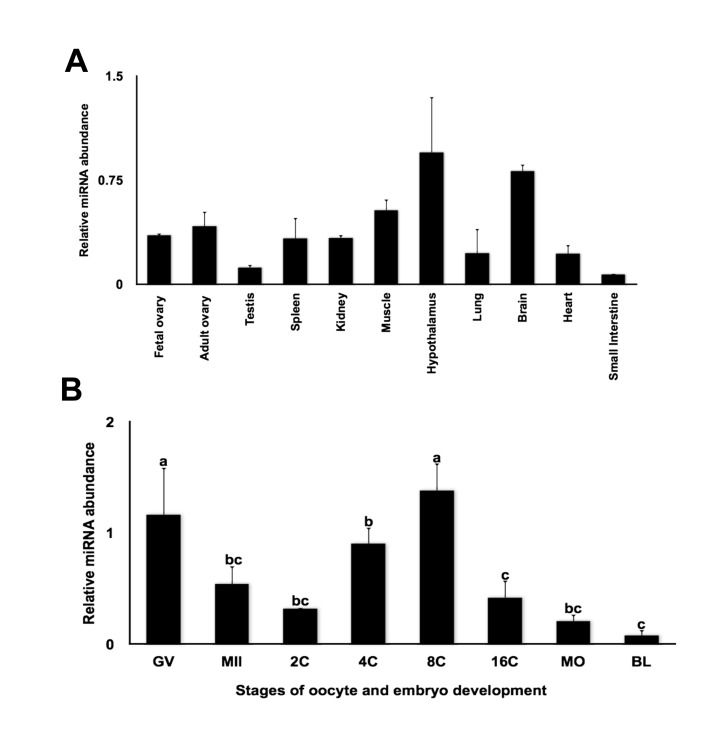
Figure 4. Expression analysis of miR-212.
(A) Tissue distribution of miR-212 analyzed by quantitative real time PCR. Data were normalized relative to abundance of endogenous control ribosomal protein S18 (RPS18) and abundance expressed as relative fold change using the sample with the lowest value as the calibrator (mean ± SEM; n = 4 per tissue). (B) Relative abundance of miR-212 in bovine oocytes and in vitro produced bovine embryos. Data were normalized to abundance of miR-125b mRNA and expressed as relative fold change using the sample with the lowest value as the calibrator (mean ± SEM; n = 4 pools of five oocytes/embryos each). Different letters indicate statistical difference (P< 0.05).

