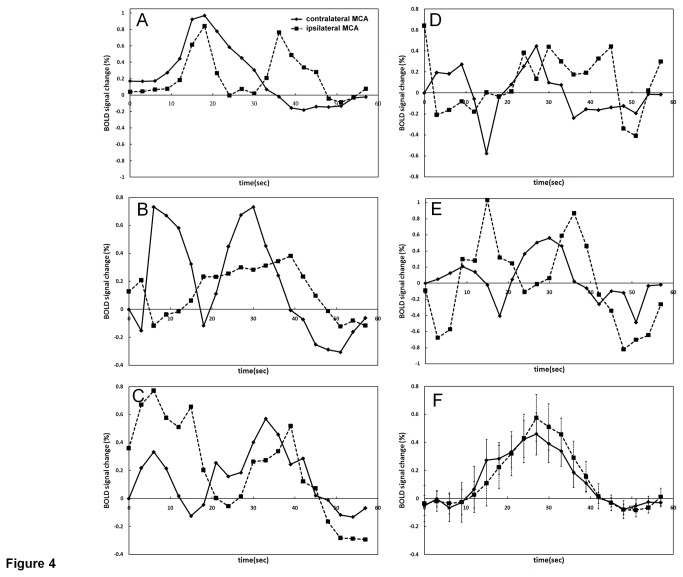
Figure 4. The time curves of contralateral and ipsilateral MCA BOLD signal changes from patients with MCA t-score<2.1, p>0.05 (ipsilateral side CVR poorly correlated with contralateral side CVR) (A-E).
The time curves averaged from the remaining 12 patients with MCA t-score≥2.1, p<0.05 (ipsilateral side CVR well correlated with contralateral side CVR). Error bars in (F) indicate one standard deviation.

