
Figure 1. V. cholerae OmpU induces NO release from treated cells.
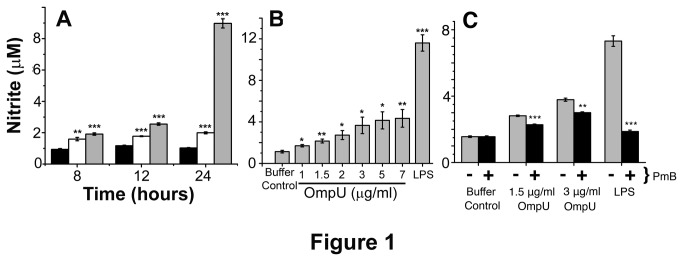
RAW 264.7 murine macrophage cells were plated and treated with OmpU or LPS or protein-buffer (10 mM Tris-Cl, 10 mM NaCl, 0.5% LDAO diluted in PBS containing 0.5% LDAO). Polymyxin B (PmB) was added to the culture 30 mins prior to OmpU or buffer treatments. LPS and protein-buffer served as positive and negative control respectively in all experiments. Supernatants were collected and analyzed by Griess reaction for the production of nitrite, a stable end product of NO. Results are expressed as mean ± SEM and represent the average of three independent experiments. For Figure 1A and 1B, *p< 0.05, **p< 0.01 ***p < 0.001 versus buffer control. For Figure 1C, *p< 0.05, **p< 0.01 ***p < 0.001 versus non-PmB treatments.
A. Time course experiments in response to OmpU shows considerable production of NO at 24 h in RAW 264.7 cells. Black solid bar represents negative control; white solid bar represents OmpU and grey solid bar represents positive control.
B. NO levels in OmpU treated cells increase in a dose dependent manner with increasing doses of OmpU. Cells were treated with different doses of OmpU and incubated for 24 h.
C. RAW 264.7 murine macrophage cells release slightly less NO when treated with OmpU along with PmB compared to cells treated with OmpU alone. RAW 264.7 cells were treated with buffer, 1.5 µg/ml and 3 µg/ml OmpU or 1 µg/ml LPS. Simultaneously, another set of cells were pre-treated with PmB and after 30 mins, cells were similarly treatmented. After 24 h, NO levels were assessed. Gray bars represent cells without PmB treatment. Black bars represent cells with PmB treatment.