
Figure 2. TNFα production in response to OmpU.
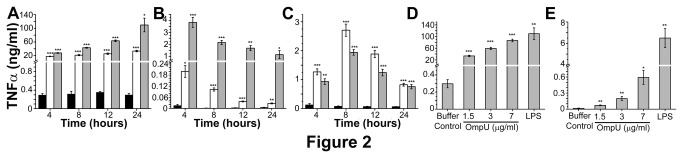
RAW 264.7 murine macrophage cells, THP-1 human monocytic cells and human PBMCs were plated and treated with OmpU or LPS (1 µg/ml) or protein-buffer. PmB was added to the culture 30 mins prior to OmpU and buffer treatments. LPS and protein-buffer served as positive and negative controls respectively in all experiments. Supernatants were collected at various time points and analyzed for presence of TNFα by sandwich ELISA. Results are expressed as mean ± SEM and represent the average of three independent experiments. *p< 0.05, **p< 0.01 ***p < 0.001 versus buffer control. Black solid bar represents negative control; white solid bar represents OmpU and grey solid bar represent positive control in Figure 2A, 2B and 2C.
A. A time dependent increase of TNFα was observed in RAW 264.7 cells in response to OmpU treatment.
B. Time course experiments in THP-1 cells showed a time dependent decrease in TNFα production in response to OmpU treatment.
C. Time course experiments in PBMCs showed a peak response of TNFα production at 8 h in response to OmpU treatment.
D. Dose dependent increase in TNFα levels was observed in response to OmpU treatment in RAW 264.7 cells. Cells were treated with 1.5 µg/ml, 3 µg/ml and 7 µg/ml OmpU and incubated for 24 h.
E. An increase in TNFα production was observed in THP-1 cells with increase in OmpU doses. Cells were treated with 1.5 µg/ml, 3 µg/ml and 7 µg/ml OmpU for 4 h.