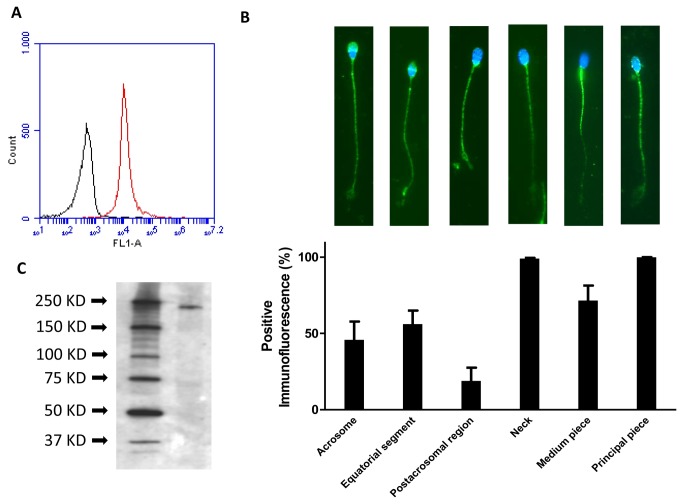
Figure 2. Immunolocalization of the Nav1.8 protein in human sperm.
(A) Flow cytometry plots of spermatozoa after overnight labeling with a Na v1.8 antibody (red plot) and the negative control treated with secondary antibody alone (black plot), n = 9. (B) Immunofluorescence images of sperm cells stained with a primary antibody against Na v1.8. Bar graph represents the distribution of this voltage-gated sodium channel in different sperm regions and the percentage of sperm cells showing each specific localization, n = 9. Scale bar, 10 μM. (C) Western blot analysis of Nav1.8 in human sperm homogenates using the Nav1.8 rabbit polyclonal antibody ab-66743. Molecular mass is indicated on the right side of the panel. The figure is representative of results obtained in 6 separate protein preparations from 6 different donors.

