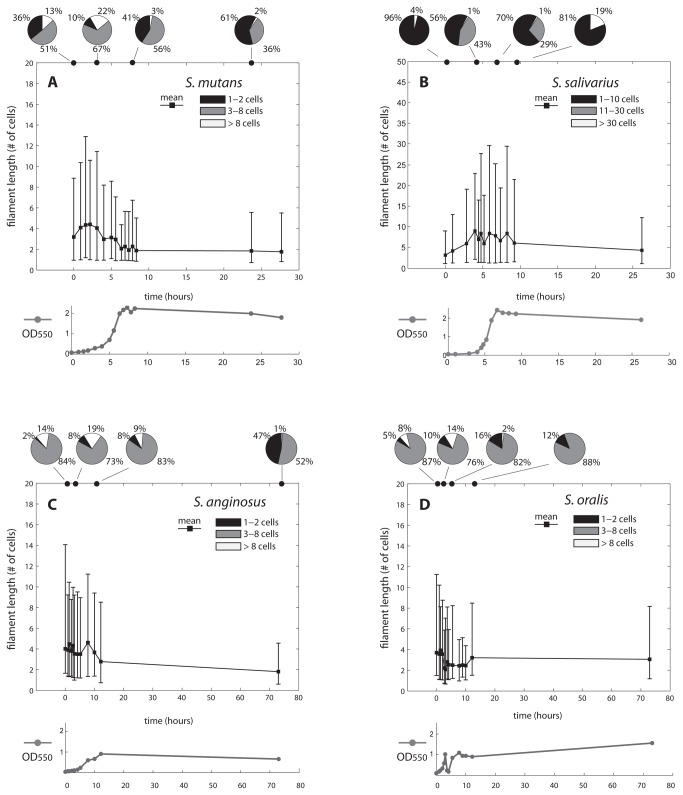
Figure 1. Mean filament length and growth curves at successive time points.
The plots show the mean filament length (black line) and optical density (OD550) measurements (grey line) of S. mutans, S. salivarius, S. anginosus and S. oralis at successive time points during growth. Data are based on the analysis of six pictures coming from two distinct wells per time point, from one representative experiment. Length was calculated in terms of number of cells of the filaments. Lower and upper edges of the error bars indicate the 2.5th and 97.5th percentiles respectively. Pie charts on top of each plot indicate the distribution of short, medium and long filaments at four distinct growth phases. These categories correspond to 1-2, 3-8 and more than 8 cells in the case of S. mutans, S. anginosus and S. oralis. In the case of S. salivarius, they correspond to 1-10, 11-30 and more than 30 cells. The y-axis scale of S. salivarius differs from the others for a better visualization of the plot.

