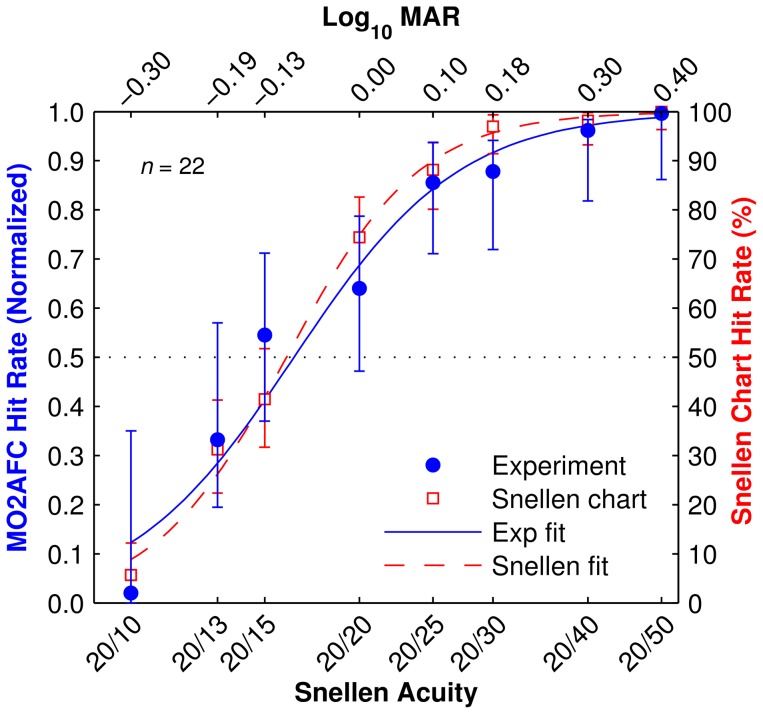
Figure 8. Validation results.
Hit rate as function of font sizes (translated to the equivalent acuity) for the standard Snellen chart test (red unfilled squares) and the multiple-optotype two alternative forced choice (MO2AFC) letter recognition task (blue filled circles). Error bars are two-sigma confidence levels. Smooth traces are sigmoid fits to each data set. Uneven spacing across the horizontal axis reflects the step sizes between lines in the standard Snellen chart. Results from the letter recognition task have been normalized to span [0–1], an equivalent range as the Snellen chart test (0%–100%), for ease of comparison. The two curves are in high agreement, although there appears to be a trend to a shallower transition with the letter recognition task, possibly due to uncorrected false negatives at the upper end of the range.

