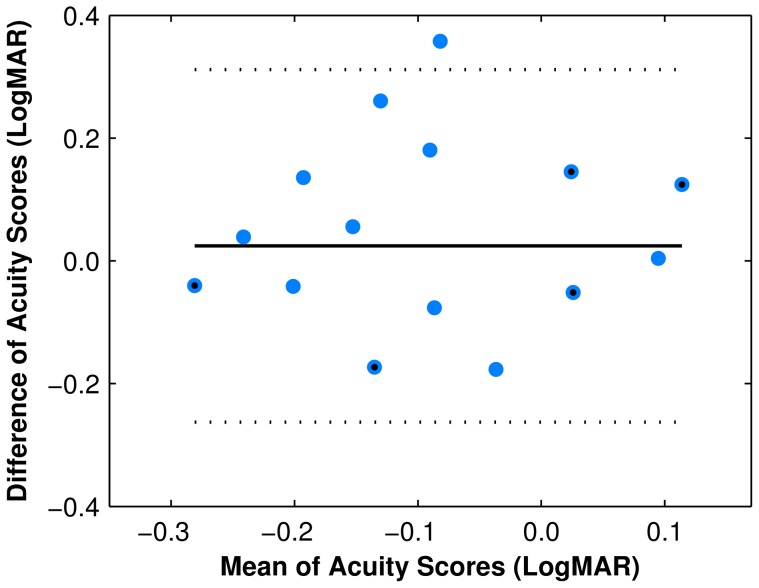
Figure 9. Validation analysis.
Bland-Altman plot of the differences in visual acuity scores between our letter recognition task and the Snellen chart test. The vertical axis displays the difference between measurements on both tasks, and the horizontal axis displays the mean acuity score value between the tasks. The solid line is the mean difference in LogMAR acuity (−0.02), and the area within the dotted lines represents the limits of agreement between LogMAR scores in the two visual acuity tasks. Each point represents the results from a single subject (blue circles), although some are overlapped (blue circles with black centers).

