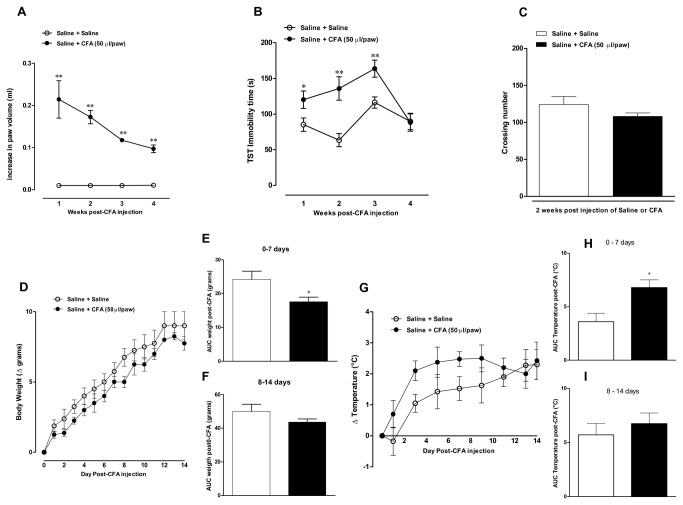
Figure 1. Time-related effects of CFA injection into the mouse paw.
Effect of intraplantar injection of CFA (50 μl/paw) 1, 2, 3 and 4 weeks: (A) Paw edema analyzed in a plesthysmometer (difference between the right and the left paws), (B) immobility time in tail suspension test (TST), and (C) locomotor activity in the open-field test, (D) changes of body weight (Δ grams), (E) AUC of body weight, 0 to 7 days post-CFA injection, (F) AUC of body weight, 8 to 14 days post-CFA injection, (G) variation of body temperature, after injection of CFA (Δ °C), (H) AUC of body temperature 0 to 7 days post-CFA injection and (I) AUC of body temperature 8 to 14 days post-CFA injection. Each point or column represents the mean ± SEM of 6-8 animals per group. *P < 0.05 and **P < 0.01 significantly different from Saline+Saline group (ANOVA followed by Bonferroni’s post-hoc test).

