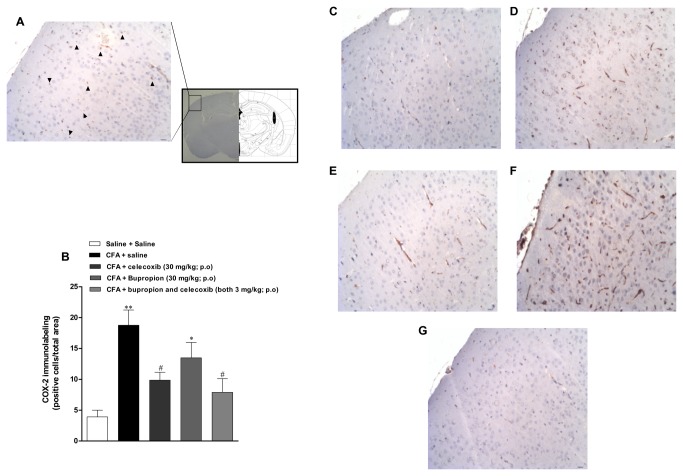
Figure 7. Immunolabelling for COX-2 in the cortex brain of CFA-treated mice: effects of treatment with bupropion and celecoxib.
Immunohistochemistry analysis for COX-2 after intraplantar injection of CFA (50 μl/paw) at 2 weeks. Arrowheads (▲) indicate positive immunostaining for COX-2. Representative images of immunohistochemistry analysis for COX-2 in the mouse brain cortex: (A) schematic representation of the mouse brain indicating the region used for quantification (C) Control saline + saline group, (D) CFA + saline, (E) CFA + celecoxib (30 mg/kg, p.o., once a day, 7 days; respectively), (F) CFA + bupropion (30 mg/kg, p.o., once a day, 7 days; respectively), (G) CFA + bupropion and celecoxib (3 mg/kg, p.o., once a day, 7 days; both drugs). (B) Graphic showing the semi-quantitative analysis of immunostaining for COX-2. Scale bar represents 10,000 µm. Each column represents the mean ± SEM of 4 animals per group. **P < 0.01 significantly different from Saline+Saline group, # P < 0.05 significantly different from CFA+Saline group (ANOVA followed by Bonferroni’s post-hoc test).

