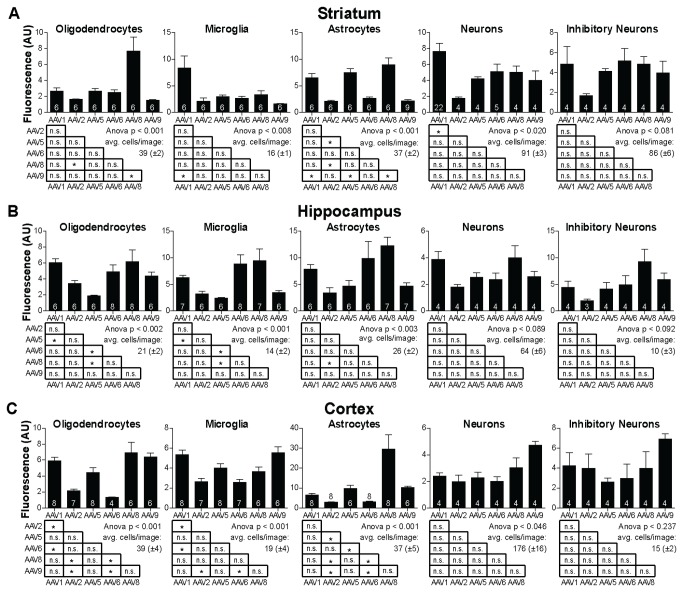
Figure 3. Summary of cell-type specific expression analysis.
A) Data obtained from striatum: average of the median florescence levels for oligodendrocytes, microglia, astrocytes, neurons and inhibitory neurons for all of the analyzed six serotypes. Number of analyzed sections is shown at the bottom of the bars. Statistical analysis of fluorescence measurements shown below bar graphs. Asterisks indicate significant differences at the p<0.05 level. B) same as A), however, showing data obtained from hippocampal injections. C) same as A), however, showing data obtained from auditory cortex injections. All bars represent mean±SEM.

