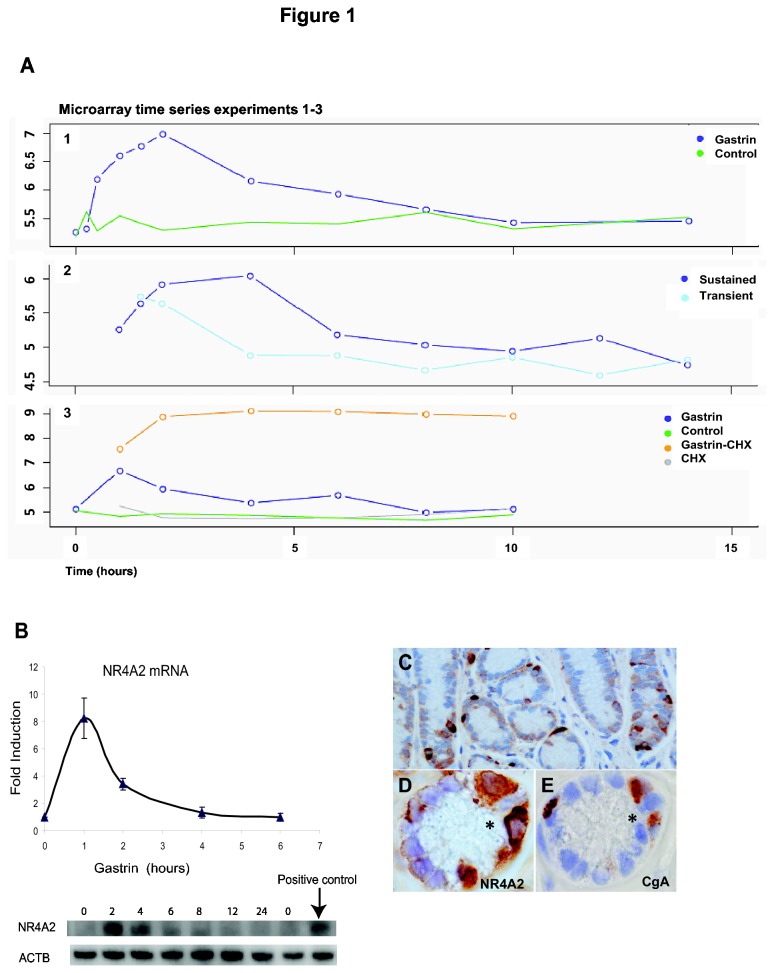
Figure 1. NR4A2 is induced by gastrin.
A: Temporal profiles of gastrin induced NR4A2 mRNA expression in pancreatic adenocarcinoma cells (AR42J). The panels show data from three independent microarray time series experiments (accession numbers E-MATAB-1268 and GSE32869); and the data points are presented as normalized log2-transformed signal intensities. Experiment 1: mRNA expression level for untreated (green line) and sustained gastrin treated (blue line) cells. Experiment 2: mRNA level in cells treated in a sustained mode (14 h of continuous presence of gastrin) and in a transient mode (gastrin was removed after 1 h of treatment). Experiment 3: sustained gastrin treatment was measured in the presence (orange line) and absence (blue line) of cycloheximide (CHX) at 6 different time points between 1 and 10 h. Green and grey lines show mRNA levels in untreated and CHX treated control cells, respectively. All data points are mean of two biological replicates. Gastrin (10 nM) treated and untreated control cells were grown in parallel and harvested (pool of 2-3 technical replicates) at several time points, as indicated in the panels. In experiments with transient versus sustained gastrin treatment, the growth medium of untreated and gastrin treated cells was removed 1 h after gastrin treatment; the cells were then washed with serum-free medium before fresh serum-free medium with gastrin (sustained gastrin treated cells) or without gastrin (transiently gastrin treated or untreated cells) was added. In experiments with the protein synthesis inhibitor cycloheximide (CHX), pre-treatments with CHX (10 µg/ml) were initiated 30 min before gastrin (10 nM) was added. B: NR4A2 mRNA and protein level in gastrin treated (5 nM) AGS-GR cells. qRT-PCR data shown are mean ± SEM of four biological replicas. Western blot image shows NR4A2 protein. Immunostaining for NR4A2 in normal gastric oxyntic mucosa is shown in panels C-E: Strong NR4A2 immunoreactivity (C) in scattered single cells in normal gastric oxyntic mucosa. Overlap between the cells showing strong NR4A2 immunoreactivity (D) and CgA immunoreactive neuroendocrine cells (E) in serial sections (C at x400 magnification, E and F at x1000 magnification).

