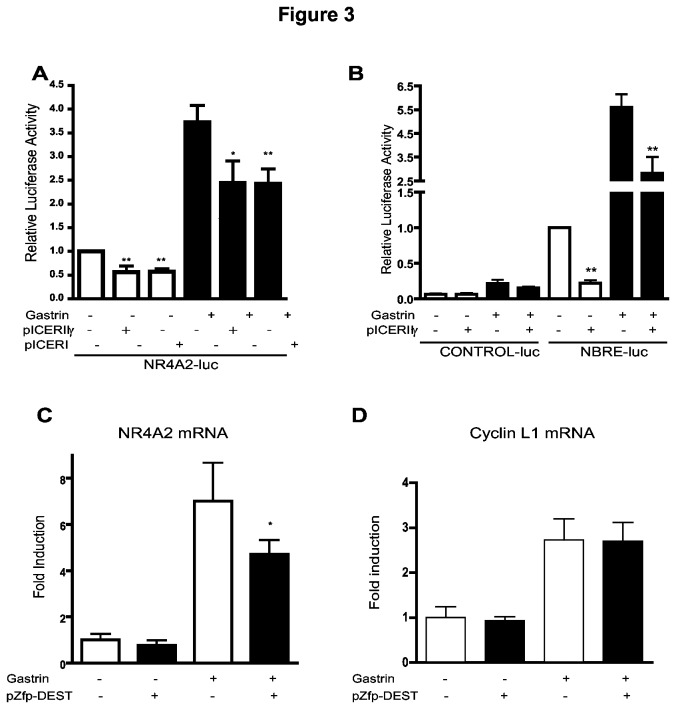
Figure 3. Negative regulation of gastrin-induced NR4A2 expression.
A: AGS-GR cells transfected with NR4A2-luc and ICER expression plasmids or empty vector. Cells were treated with gastrin for 6 h prior to measurement of NR4A2 activity. Data shown represent mean ± SEM of five biological replicas (** p<0.03, * p = 0.06). B: AGS-GR cells transfected with NBRE-luc and ICER expression plasmid or empty vector and treated with gastrin for 4 h prior to measurement of NBRE activity. Data shown represent mean ± SEM of four biological replicas (** p<0.03). C: AGS-GR cells were transfected with pZfp36l1 expression plasmid or empty vector and treated with gastrin (5 nM) NR4A2 mRNA expression was measured by qRT-PCR. Data shown represent one of three biological replicas; mean ± SD of three technical replicas is shown. D: Cyclin L1 represents one of three control genes examined.

