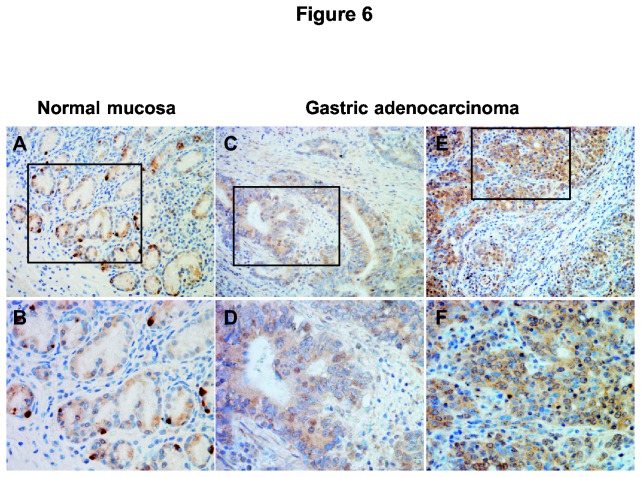
Figure 6. Immunostaining of NR4A2 in gastric adenocarcinoma.
A-B: NR4A2 immunoreactivity in normal oxyntic mucosa showing strong intensity in scattered single cells (neuroendocrine cells) and weaker staining intensity in the other epithelial cells. C-F: NR4A2 immunoreactivity in gastric adenocarcinomas of intestinal (C-D) and diffuse (E-F) type, showing a general staining in tumor cells with mixed nuclear or cytoplasmic localization and variable intensities. (A, C, E at x200 magnification, with boxes representing B, D and F at x400 magnification).

