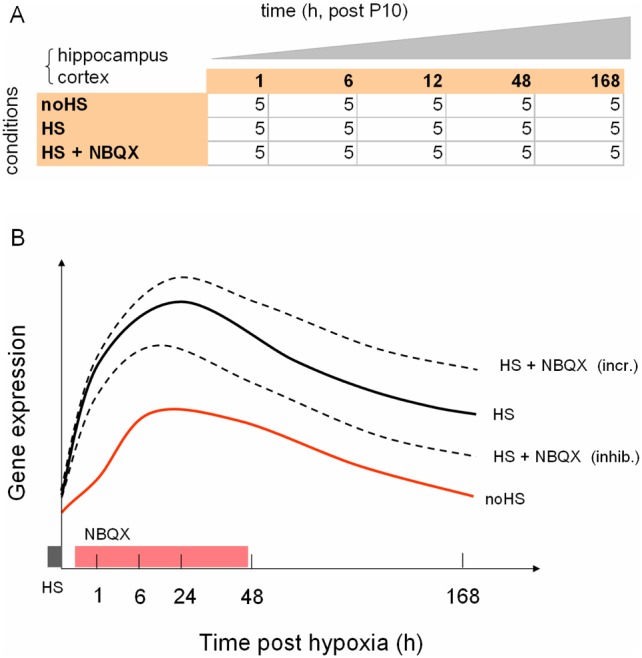
Figure 1. Experimental design for profiling of the hypoxic seizure model.

A. Factorial table showing the average number of replicates per combination of treatment condition and sampling time (hours, post P10) for each tissue separately, for a total of 144 samples profiled; noHS = no hypoxic seizures induced (baseline condition), HS = hypoxic seizures induced at t = 0 h, HS + NBQX = hypoxic seizures induced at t = 0 h, followed by four IP administrations of NBQX over a 48 h period. Control vehicle injections were performed at the same times over the same 48 h period under the noHS and HS treatments. B. Cartoon indicating the location of the sampling times and the duration of hypoxic shock (gray bar) and NBQX (rose bar) treatments, alongside hypothetical gene expression profiles for a developmentally modulated gene which also shows persistent activation after hypoxia-induced seizures (HS profile) relative to the baseline (noHS profile). Two possible responses to NBQX treatment are indicated (increase or decrease).
