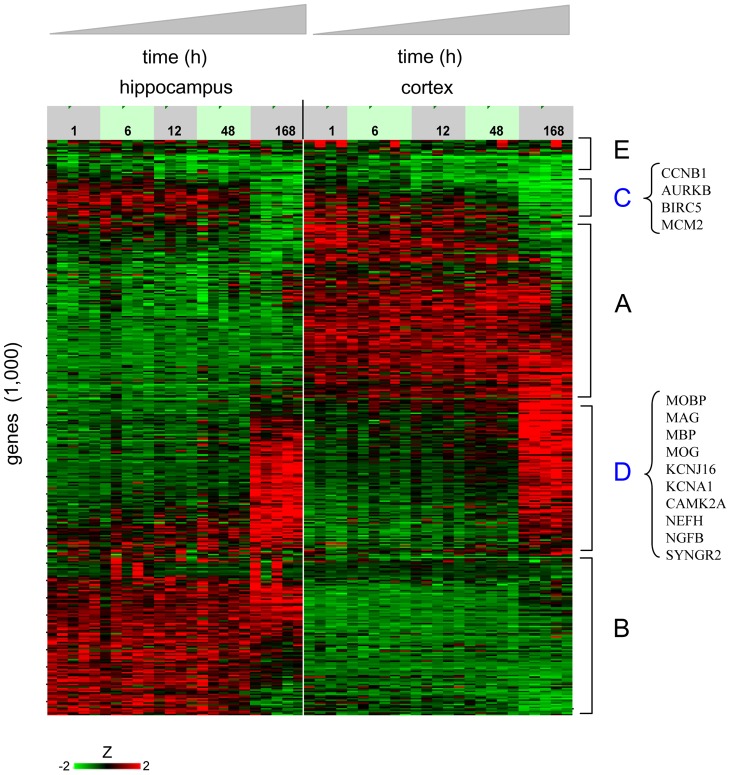
Figure 2. Baseline developmental time courses show tissue-specific as well as common gene expression patterns.
Gene expression profiles are displayed for hippocampus (left) and cortex (right), over the time period P10–17. Clustered expression intensities standardized to Z-scores are shown for the thousand genes with most significant variation across all samples. The color scale saturates at Z = ±2. Cluster A: genes with expression specific to cortex; B: genes with expression specific to hippocampus; C: set of genes repressed in time in both tissues, containing many genes for cellular proliferation control; D: set of genes induced in time in both tissues, containing many genes specifying mature neuronal lineages; E: common set of genes with no significant changes of expression.

