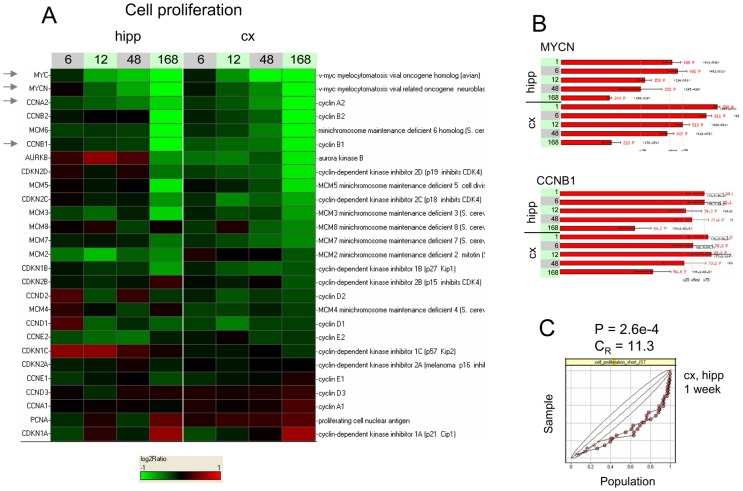
Figure 3. A cellular proliferation gene set shows strong repression under baseline developmental conditions.
A. Log2-ratios of gene expression relative to the 1 h time point, in each tissue separately, are displayed as a heat map, with sampling times post-P10 indicated in hours. Colors saturate for log2-ratio = ±1. Almost all members of this manually curated gene set representing cellular proliferation are repressed over time. B. Detailed intensity profiles for MYCN and cyclin B1 (CCNB1) showing strong repression at t = 1 week. C. KS plot showing the distribution of the log2-ratios at t = 1 week for both tissues. P-value and enrichment are reported for hippocampus only. Hipp = hippocampus, cx = cortex. The arrows point to some of the genes referred to in the main text.

