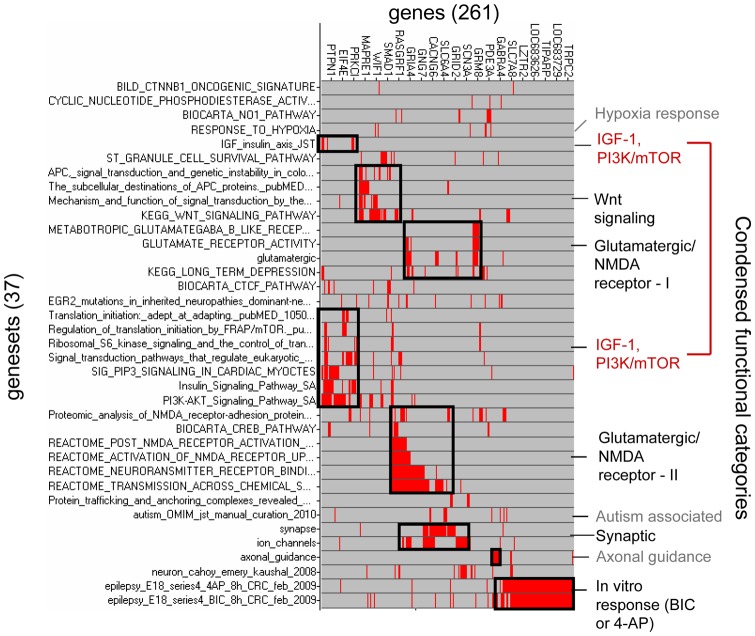
Figure 7. Geneset × gene membership matrix for the hypoxic seizure response.
The clustered {geneset × gene} membership matrix for the 37 gene sets and the corresponding 261 leading-edge genes selected by gene set enrichment analysis of the hippocampal hypoxic seizure response at t = 12 hours is shown. Red indicates presence of a gene (column) in given gene set (row), and gray its absence in a given gene set. 9 functional clusters, named on the right-hand-side of the figure, were determined by visual inspection. Note that the IGF-1/PI3K/mTOR “cluster” actually consists of two groups (red lettering).

