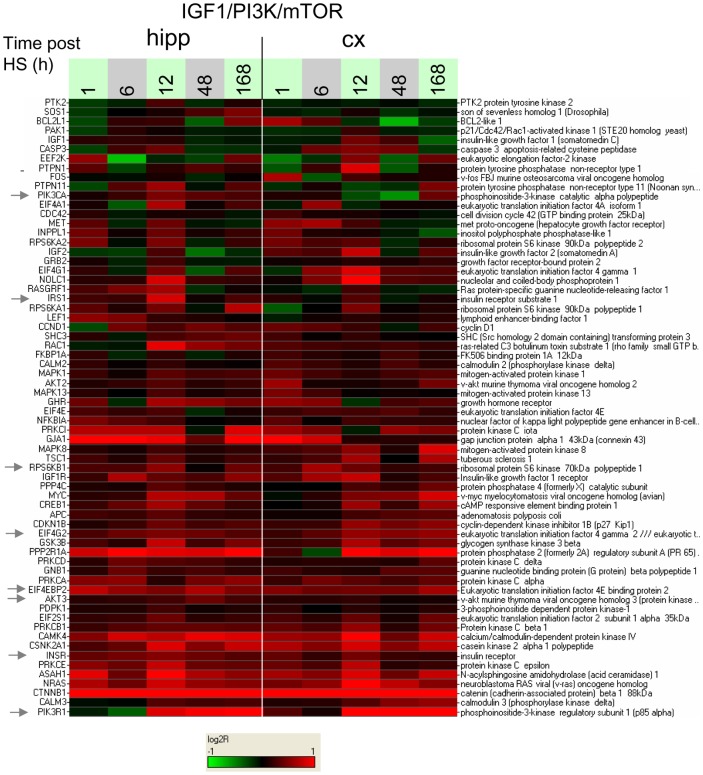
Figure 10. Heat map of response to hypoxic seizures for the genes in the IGF-1/PI3K/mTOR group.
Log2-ratios of gene expression of HS to time-matched normoxic controls are displayed for the genes in the IGF-1/PI3K/mTOR group defined by inspection of the enrichment membership matrix of Figure 7. Sampling times post-P10 are indicated in hours. Colors saturate for log2-ratio = ±1.

