
Figure 3. Functional connectivity during hand movements.
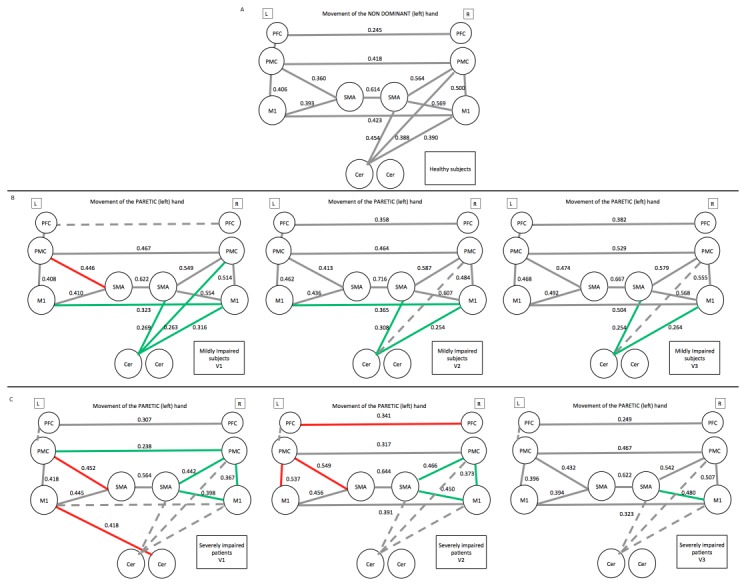
(A) Movements of the left hand in healthy subjects, and of the paretic hand in (B) mildly impaired and (C) severely impaired patients.
In patients, grey lines indicate that correlations were normal and identical to the healthy subjects, red lines indicate that correlations were increased, and green lines indicate that correlations were reduced compared with healthy subjects. Dotted lines indicate that the correlation is not significant in the group of patients. The level of the significant correlations is indicated near the corresponding line. Abbreviations: L: left, R: right, V1, V2 and V3: visit 1, 2 and 3.