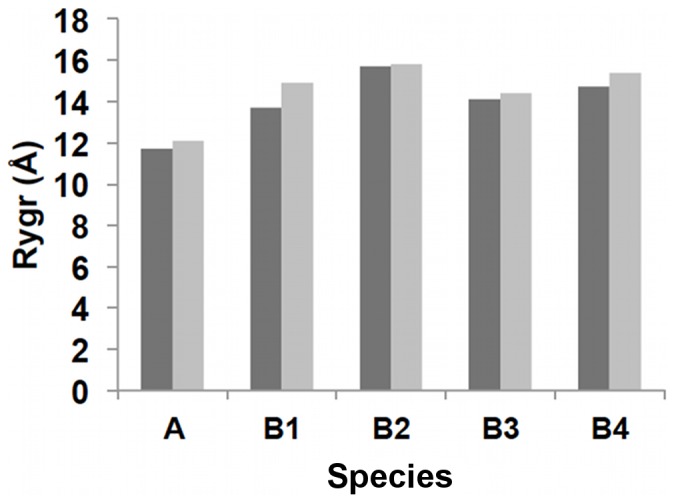
Figure 9. Average Equilibrium Radius of Gyration (Rygr) (Å).

Average equilibrium radii of gyration are shown. A shows Zn(Aβ) (where Zn binds at Glu11 His6, 13 14) and control. B1 shows Zn(Aβ)2 (where Zn bridges at Glu11 and His6) and control. B2 shows Zn(Aβ)2 (where Zn bridges at Glu11 and His13) and control. B3 shows Zn(Aβ)2 (where Zn bridges at His13 and His 14) and control. B4 shows Zn(Aβ)2 (where Zn bridges at Glu11 and His14) and control. Dark gray lines are for Zn-bound complexes. Gray lines are for controls.
