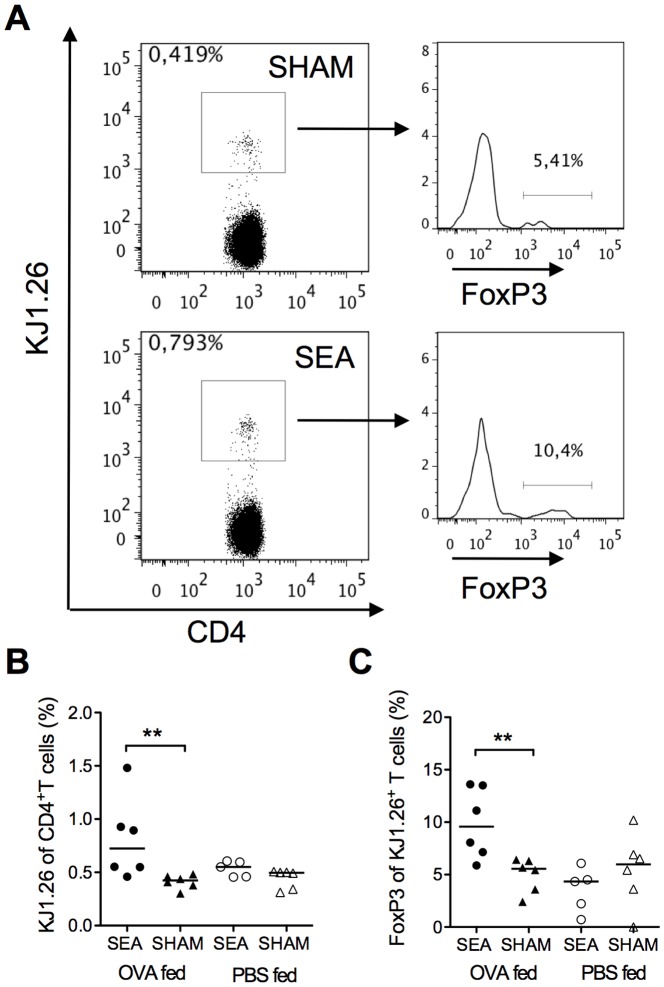
Figure 2. Neonatally SEA-treated mice exhibit a stronger OVA-specific response after oral tolerization with OVA.
Mice (n = 5–6) were fed staphylococcal enterotoxin A (SEA) or PBS (SHAM) perorally on six occasions during the first two weeks of life. At six weeks of age all mice were injected i.v. with 1×10⁶ OVA-specific DO11.10 CD4+ T cells. At 8 h post cell transfer mice were fed 5 mg OVA or PBS and at 15 h later all mice were sacrificed and mesenteric lymph nodes (MLN) were collected for flow cytometric analysis. MLN cells were stained for surface expression of CD4, and the OVA-specific T cell marker KJ1.26 and for intracellular FoxP3. (A) Representative dot plots of MLN cells stained with CD4 and KJ1.26 and histograms of the CD4+KJ1.26+ population showing FoxP3. (B) Proportion of KJ1.26+ of CD4+ T cells. (C) Proportion of FoxP3+ of KJ1.26+CD4+ T cells. In B–C, each symbol represents one animal and the horizontal line shows median value of the group. Data are representative from two independent experiments. ** P<0.01, analyzed with Mann-Whitney U-test.

