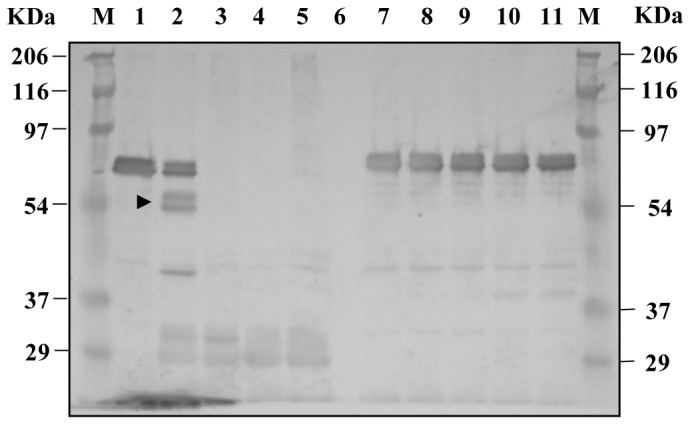
Figure 2. Western blot analysis of AGM13 and VCSM13 phage samples treated with different concentrations of trypsin.

Aliquots equivalent to 1.5×10¹⁰ trypsin-untreated and -treated phages (analyzed in Table 1) were separated by 10% SDS-PAGE under reducing conditions, transferred onto 0.45 µ PVDF membranes and probed with polyclonal antibodies against bacteriophage M13. M: Prestained marker; Lanes 1–5: 1.5×10¹⁰ AGM13 phages treated with 0, 0.1, 1, 10 and 100 µg/ml trypsin, respectively; Lane 6: empty; Lanes 7–11: 1.5×10¹⁰ VCSM13 phages treated with 0, 0.1, 1, 10 and 100 µg/ml trypsin, respectively.
