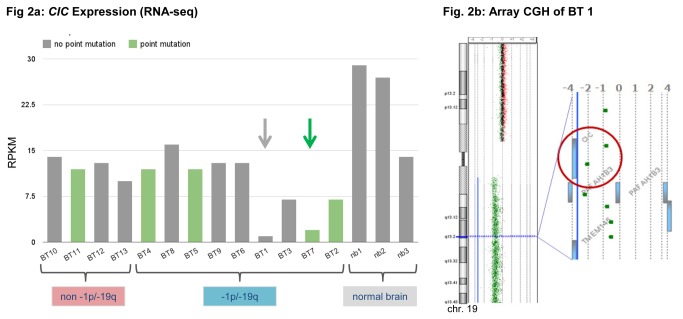
Figure 2. CIC Expression analysis and homozygous deletion of CIC in array CGH in tumor sample BT1.
2a Column plot of expression of the CIC gene in tumor samples (BT1-15) and normal brain (nb1-3) analyzed using RNA-seq. Tumor samples harboring point mutations are marked as green columns, samples without point mutations as gray columns. Compared to other tumor samples, BT1 (gray arrow) and BT7 (green arrow) show a strong down regulation of CIC. This can be explained by a homozygous deletion of CIC in BT1 (compare Figure 2b) and nonsense-mediated mRNA decay due to a frameshift mutation in BT7. RPKM = Reads Per Kilobase of exon model per Million mapped reads (gene counts/total counts of each sample). 2b: Array CGH results of BT1 harboring a partial homozygous deletion of CIC (red circle). One oligonucleotide-probe situated within CIC and another in PAFAH1B3 (A_16_P21013642: [hg19] 42,795,949-42,796,008 and A_14_P124269: [hg19] 42804518-42804577) showed a log2-ratio of -2, while the whole long arm of chromosome 19 displayed a log2-ratio of -0.9 (corresponding to one allele in the tumor and two alleles in the control probe in array CGH). The log2-ratio of -2 indicates a homozygous deletion in about 75% of the cell population, corresponding to a background due to normal cells in the tumor tissue. Array CGH narrows the exon-spanning deletion of the second allele of CIC to a minimum size of 8.6 kb and a maximum size of 17.3 kb.

