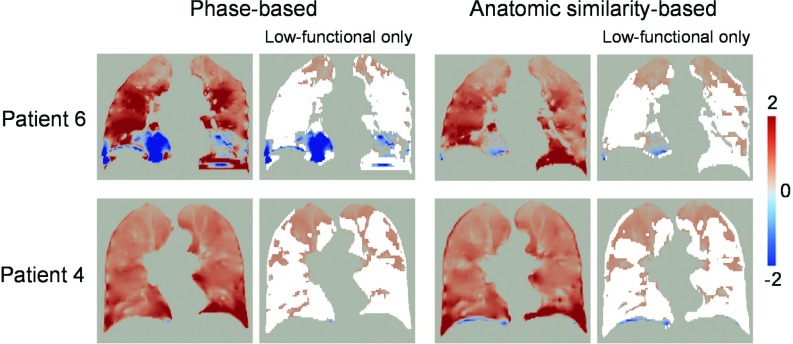
Figure 3.
Ventilation images derived from the phase-sorted and anatomic similarity-sorted 4D CT images for patients 6 and 4. The segmented low-functional lung volumes are also shown (nonlow functional lung volumes shaded white). Patients 6 and 4 demonstrated voxel-based Spearman correlations of 0.62 and 0.85, respectively. Note that ventilation is normalized by the overall mean value [see Eq. 6]. A positive value represents local expansion, while a negative value represents local contraction. The coronal levels of the images are the same as those of Fig. 1.

