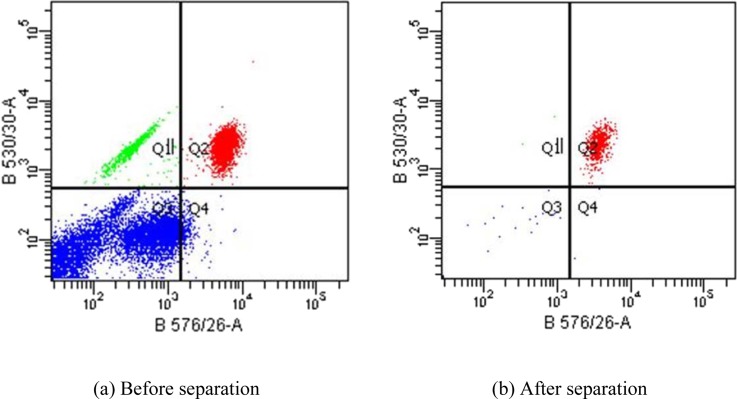
Figure 7.
Flow cytometric analysis of CD4 + cell isolation. The concentration of the CD4 + cells prior to isolation was 17.2% as indicated by the Q2 quadrant on the dot plot. Q1, Q3, and Q4 quadrant represent non-target cell populations. After isolation, the purity of the CD4 + cells was increased to 96.6%.

