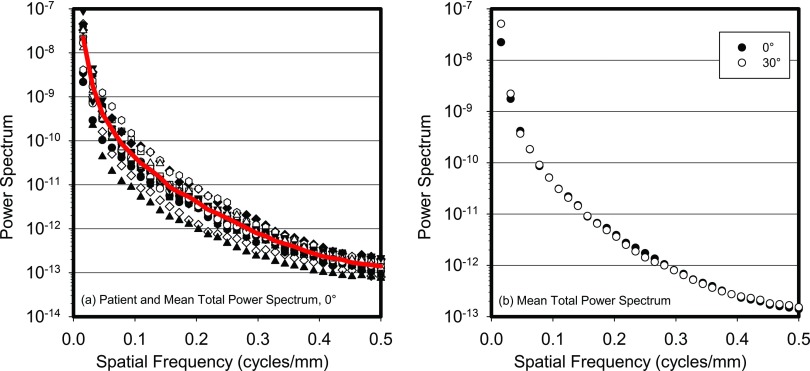
Figure 1.
(a) Power spectra of the total (primary + scatter) signal for all 16 patients studied (symbols) and the result of averaging across all patients (line). (b) Average across all patients of the total power spectra for the 0° and 30° projections. All power spectra are before division by the sinc function.

