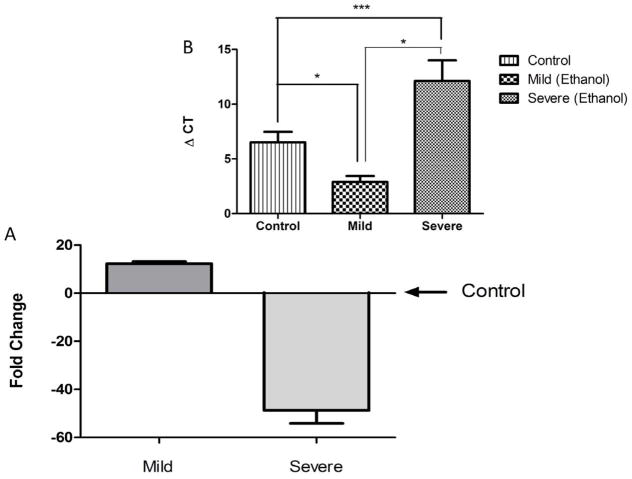
Figure 3.
Real-time RT-PCR analysis indicates that at 48 hpf, ethanol exposed zebrafish that show mild anatomical defects (< 2 scored defects) exhibit a significant increase (fold change relative to the mean of controls) in miR9 expression, whereas severely affected animals (>3 scored defects) exhibited significantly decreased miR-9 expression compared to non exposed controls. Inset graph shows ΔCT relative to U6 snRNA. Lower ΔCTs indicate higher levels of miRNA expression compared to higher ΔCTs. Data expressed as mean ± SEM, n = 3–7/group. *, p<0.05; ***, p<0.0001.

