
Figure 5.
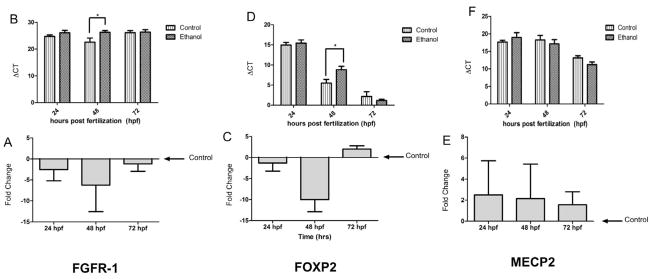
FGFR-1 and FOXP2 are downregulated following ethanol exposure in zebrafish embryos. A, C and E show fold-change relative to control and B, D and F show ΔCT (higher ΔCTs indicate lower mRNA expression). Following ethanol exposure, FGFR-1 (A and B) and FOXP2 (C and D) are downregulated at 48hpf while MECP2 (E and F) remains unchanged. All mRNA levels remain unchanged at 24 and 72hpf. Data expressed as mean±SEM, n=4–5/group. Asterisks indicate statistically significant comparisons of ΔCT, p<0.05.