Figure 7.
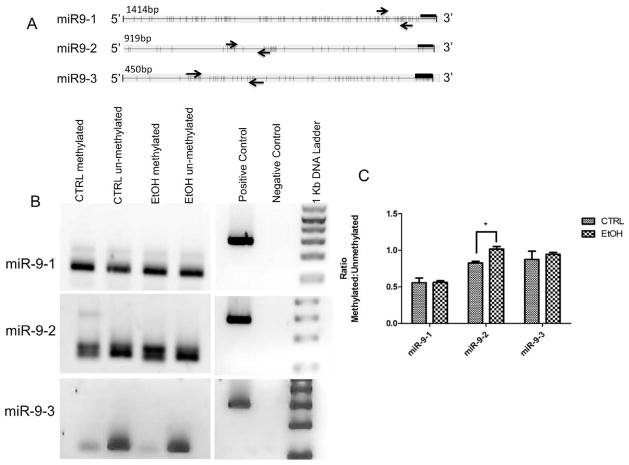
Ethanol effects on methylation at miR-9 loci changes with ethanol exposure. A) Maps of mammalian miR9 gene loci depicting the proximal 5′ sequence with predicted CpG dinucleotides represented as vertical bars. Each 5′ region coincides with assessed RNA polymerase II and transcription factor binding sites (UCSC genome browser, genome.ucsc.edu). Arrows indicate forward and reverse methylation specific primers Methyl Primer Express ® software version 1.0 (Applied Biosystems, CA, USA). Black bars indicate location of the miR-9 gene. B) Size fractionation of PCR products shows that the 5′ regions of miR-9 genes exhibit evidence for differential methylation. MSP primers detect high levels of methylation in miR-9-1 and miR-9-2 promoter regions compared to the miR-9-3 locus. C) Quantitative analysis of miR-9 loci methylation. Graph represents ratio of methylated to unmethylated CpG dinucleotides shown in A (n=3–4/group). Ethanol exposure leads to a significant increase in methylation at the miR-9-2 locus.

