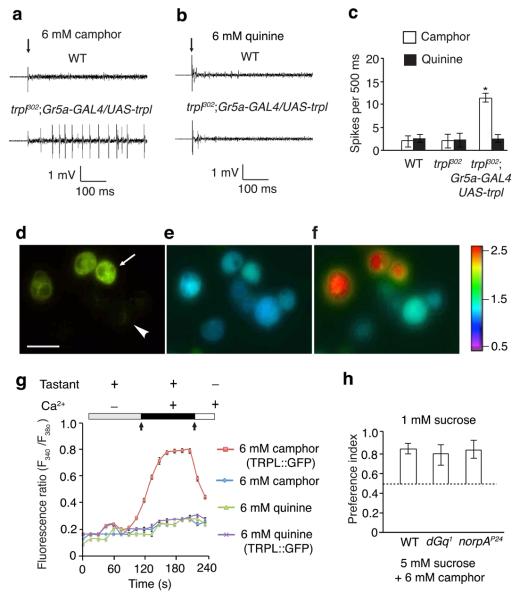
Figure 4. Camphor directly activated TRPL.
(a–c) Sample tip recordings and quantification showing that camphor, but not quinine, induced action potentials after misexpression of trpl in Gr5a GRNs (L2 sensilla). n=10 animals. *p=0.00063. (d–f) Ca2+ photometry showing increased Ca2+ influx in S2 cells transiently expressing a TRPL::GFP fusion protein. (d) GFP-positive cells (expressing TRPL::GFP) identified by fluorescent microscopy. The arrow and arrowhead indicate examples of GFP-positive and negative cells, respectively. The scale bar indicates 10 μm. (e) F340/F380 ratio prior to addition of 6 mM camphor, 6 mM quinine or Ca2+ to the bath solution (left arrow in g). (f) F340/F380 after adding 6 mM camphor and then 2 mM CaCl2 to the bath solution (right arrow in g). The color scale indicates the F340/F380 ratios. (g) Changes in F340/F380 after adding either 6 mM camphor or 6 mM quinine, and then 2 mM CaCl2 to the bath solution. n=3 trials (20 cells/trial). (h) Comparing camphor avoidance among wild type, dGq1 and norpAP24 animals using two-way choice tests. n=3 trials. Error bars indicate SEMs. One-way ANOVA tests with Bonferroni post-hoc analysis.

