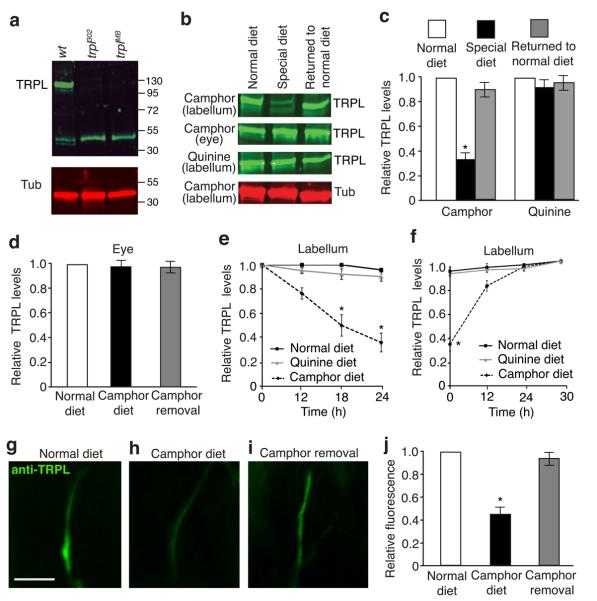
Figure 6. Effects of a camphor or normal diet on TRPL protein expression in GRNs.
(a) Western blot containing adult head extracts from wild-type and trpl mutant flies probed with anti-TRPL and anti-Tubulin. TRPL is ~123 kD. The ~55 kD band was detected non-specifically and therefore provided an additional loading control. (b) Western blots probed with anti-TRPL or anti-Tubulin. The flies were maintained on: 1) a normal diet, 2) a camphor or a quinine diet for 24 hours (special diet, indicated to the left), or 3) a special diet and then a normal diet for 24 hours (returned to normal diet). The labella and eye extracts were prepared from the same flies. The full-length blots are shown in Supplementary Fig 8d. (c) Quantification of TRPL levels in the labella after the flies were exposed for 24 hours to a 6 mM camphor diet or a 1 mM quinine diet. n=3 trials. *p=0.00012. (d) Quantification of TRPL levels in the eyes after the flies were exposed for 24 hours to a 6 mM camphor diet. (e) TRPL levels in the labella of flies maintained for 12—24 hours on a normal diet, a camphor diet, or a quinine diet. n=3 trials. *p=0.002 and 0.001 (18 and 24 h, respectively), (f) TRPL levels in flies kept on a camphor diet or a quinine diet for 24 hours followed by a normal diet for the indicated times. n=3 trials. *p=0.00011. (g–i) Immunocytochemical analysis of TRPL levels in the dendrites of GRNs after the flies were exposed to the following diets: (g) normal diet for 24 hours, (h) a camphor diet for 24 hours, (i) a camphor diet for 24 hours followed by a normal diet for 24 hours. The scale bar in f indicated 10 μm. (j) Quantification of the data in g-i. n=10 animals. *p=0.00076. The error bars indicate SEMs. One-way ANOVA tests with Bonferroni post-hoc analysis.

